
What each metric means
![]() CPU — How much processing time your account can use. Spikes = slow PHP/requests.
CPU — How much processing time your account can use. Spikes = slow PHP/requests.
![]() RAM (Memory) — Needed by PHP/scripts. If exhausted, requests can fail or restart.
RAM (Memory) — Needed by PHP/scripts. If exhausted, requests can fail or restart.
![]() I/O (Disk throughput) — Read/write speed to storage. High I/O slows uploads/exports.
I/O (Disk throughput) — Read/write speed to storage. High I/O slows uploads/exports.
![]() IOPS — Number of disk operations/second. Many tiny ops can hit this limit.
IOPS — Number of disk operations/second. Many tiny ops can hit this limit.
![]() EP (Entry Processes) — Concurrent web requests hitting PHP. Spikes during traffic bursts.
EP (Entry Processes) — Concurrent web requests hitting PHP. Spikes during traffic bursts.
![]() nPROC — Total processes your account can spawn.
nPROC — Total processes your account can spawn.
![]() Inodes — Count of files/directories. Exceeding the quota blocks new files/mail.
Inodes — Count of files/directories. Exceeding the quota blocks new files/mail.
Symptoms & quick fixes
![]() Hitting CPU/RAM: pages feel sluggish, admin slow, random 500s.
Hitting CPU/RAM: pages feel sluggish, admin slow, random 500s.
- Enable full-page caching; reduce heavy plugins/themes and disable unused ones.
- Raise PHP memory limit (cPanel → Select PHP Version → Options) within plan caps.
- Offload cron-heavy tasks or schedule them during low-traffic hours.
![]() Hitting EP/IOPS: intermittent 508/503, especially during traffic peaks.
Hitting EP/IOPS: intermittent 508/503, especially during traffic peaks.
- Add/strengthen page caching and object caching.
- Defer heavy jobs to cron/queue; limit simultaneous imports/exports.
- Trim third-party scripts (analytics/chat) that add many requests.
![]() High inodes: can’t upload files, emails bounce with “over quota.”
High inodes: can’t upload files, emails bounce with “over quota.”
- Prune old backups and large email attachments.
- Empty cache folders (e.g.,
/wp-content/cache/). - Remove unused themes/plugins and stale installations.
![]() Still hitting limits? Optimize first; if usage is consistently high after that, consider upgrading your plan.
Still hitting limits? Optimize first; if usage is consistently high after that, consider upgrading your plan.
Where to check your usage
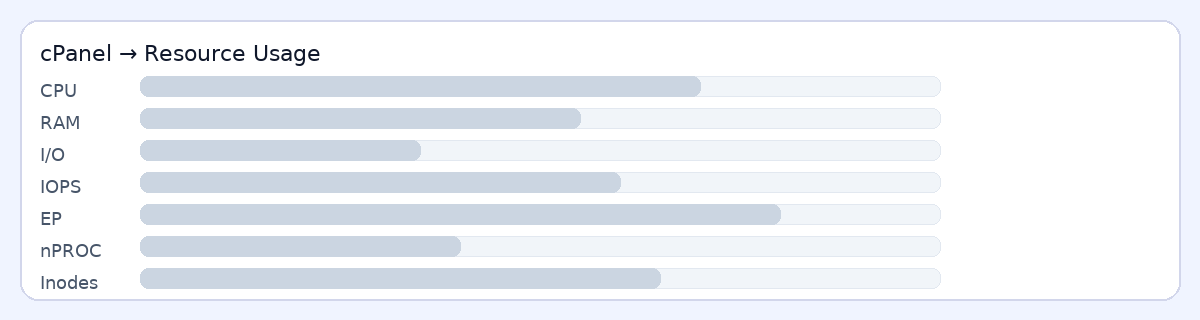
- cPanel → Resource Usage: view current/summary graphs and fault history.
- Metrics → Errors: check PHP fatal errors and plugin/theme issues.
- Disk Usage / File Manager: locate large folders and inode-heavy paths.
Pro tips
- Turn on image optimization (WebP/lazy-load) and a reputable caching plugin early.
- Keep WordPress core, plugins, and PHP version up to date for performance.
- If you expect a traffic spike, let us know—we can advise on scaling options.